Sweet Success: A Comparative Analysis Comparing the growth dynamics of E. coli DH5α with Glucose, Lactose, Sucrose, Truvia Using OD600 Measurements
Sweet Success: A Comparative Analysis
Comparing the growth dynamics of E. coli DH5α with Glucose, Lactose, Sucrose, Truvia Using OD600 Measurements
Authors: Dey, M., Leaño, S.
Abstract:
The availability of carbon sources significantly influences bacterial growth and metabolism. Escherichia coli utilizes different sugars through distinct metabolic pathways, resulting in variations in growth rate and biomass production. This study investigated the growth dynamics of E. coli DH5α cultured in LB broth supplemented with 2% (w/v) glucose, lactose, sucrose, or Truvia, a commercial sweetener primarily composed of erythritol and stevia derived glycosides. The objective was to compare bacterial growth across these carbon sources and evaluate their relative effectiveness in supporting cellular proliferation.
E. coli DH5α cultures were grown in 125 mL shake flasks containing 42 mL of supplemented media and inoculated with overnight starter cultures at a 1:20 dilution. Optical density at 600 nm (OD600) was measured every 30 minutes over a six-hour period using a microplate reader. Growth curves were generated and compared among treatments.
All cultures exhibited increasing OD600 values throughout the experiment; however, substantial differences in growth performance were observed. Glucose-supported cultures achieved the highest final OD600 (0.685), followed by lactose (0.637), sucrose (0.607), and Truvia (0.567). These results indicate that glucose served as the most readily metabolized carbon source for E. coli, while lactose and sucrose supported intermediate growth. Truvia produced the lowest biomass accumulation, suggesting that its components were poorly utilized as metabolic substrates.
Overall, the findings support established principles of carbon catabolite preference in E. coli, demonstrating that readily metabolizable sugars promote faster bacterial growth and greater biomass production. This experiment highlights the relationship between carbon source availability and microbial growth dynamics and provides insight into bacterial nutrient utilization patterns.
Introduction:
Escherichia coli adapts its metabolism to various carbon sources through highly regulated cellular transport systems and regulatory gene networks to optimize the amount of energy gained from various carbon sources. Among such processes and mechanisms, carbon catabolite repression (CCR) allows E. coli to fully utilize glucose by suppressing pathways for alternative sugars, allowing glucose to directly enter glycolysis through the phosphotransferase system (PTS) and rapidly generate ATP and other metabolites. This study will investigate how different sugars will influence the growth kinetics and the metabolic activity of E. coli by comparing its activity grown in media supplemented with different individual sugars under identical conditions. Bacterial growth will be monitored using the spectrophotometer OD600 measurement to construct growth curves and determine lag phase, exponential growth phase, doubling time, and maximum biomass.
According to current research and understanding of the metabolic processes in E. coli, it is hypothesized that glucose will produce the fastest growth and have the highest cell density because of its efficient transport through the PTS biomechanics and the carbon catabolite repression. This allows to minimize the energetic cost of substrate uptake and catabolism. On the contrary, sugars such as lactose and sucrose are expected to exhibit slower growth due to the additional enzymatic conversion prior to entering glycolysis. By investigating such relationships in metabolic sugar activity with bacterial physiology, we can provide research to give a clear insight into metabolic regulation, nutrient prioritization, and microbial adaptation in E. coli.
Despite extensive research on the molecular mechanisms of carbon metabolism and carbon catabolite repression in E. coli, relatively few studies have directly compared the growth dynamics of multiple common sugars and modern sugar substitutes under identical laboratory conditions. In particular, limited data exist regarding on how commercially available sweeteners such as Truvia influence bacterial growth relative to traditional carbohydrate sources. Additionally, many studies focus on gene regulation and metabolic pathways rather than measurable differences in growth kinetics, including biomass accumulation and growth rate. By evaluating E. coli growth across glucose, lactose, sucrose, and Truvia infused media using OD600 measurements, this study addresses these gaps by providing a direct comparison of carbon source utilization and its effects on bacterial physiology under controlled experimental conditions. This research contributes to a better understanding of nutrient preference, metabolic efficiency, and microbial adaptation in response to different available carbon sources.
Methods:
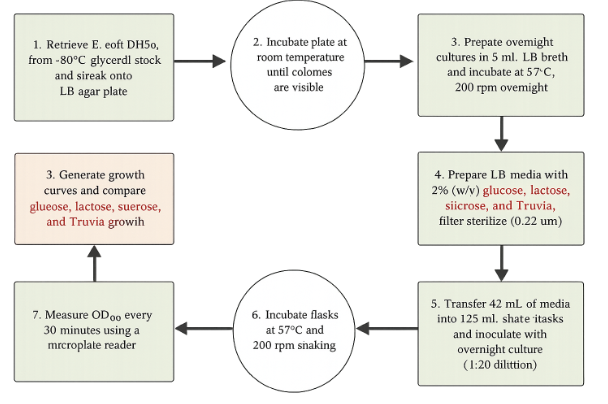
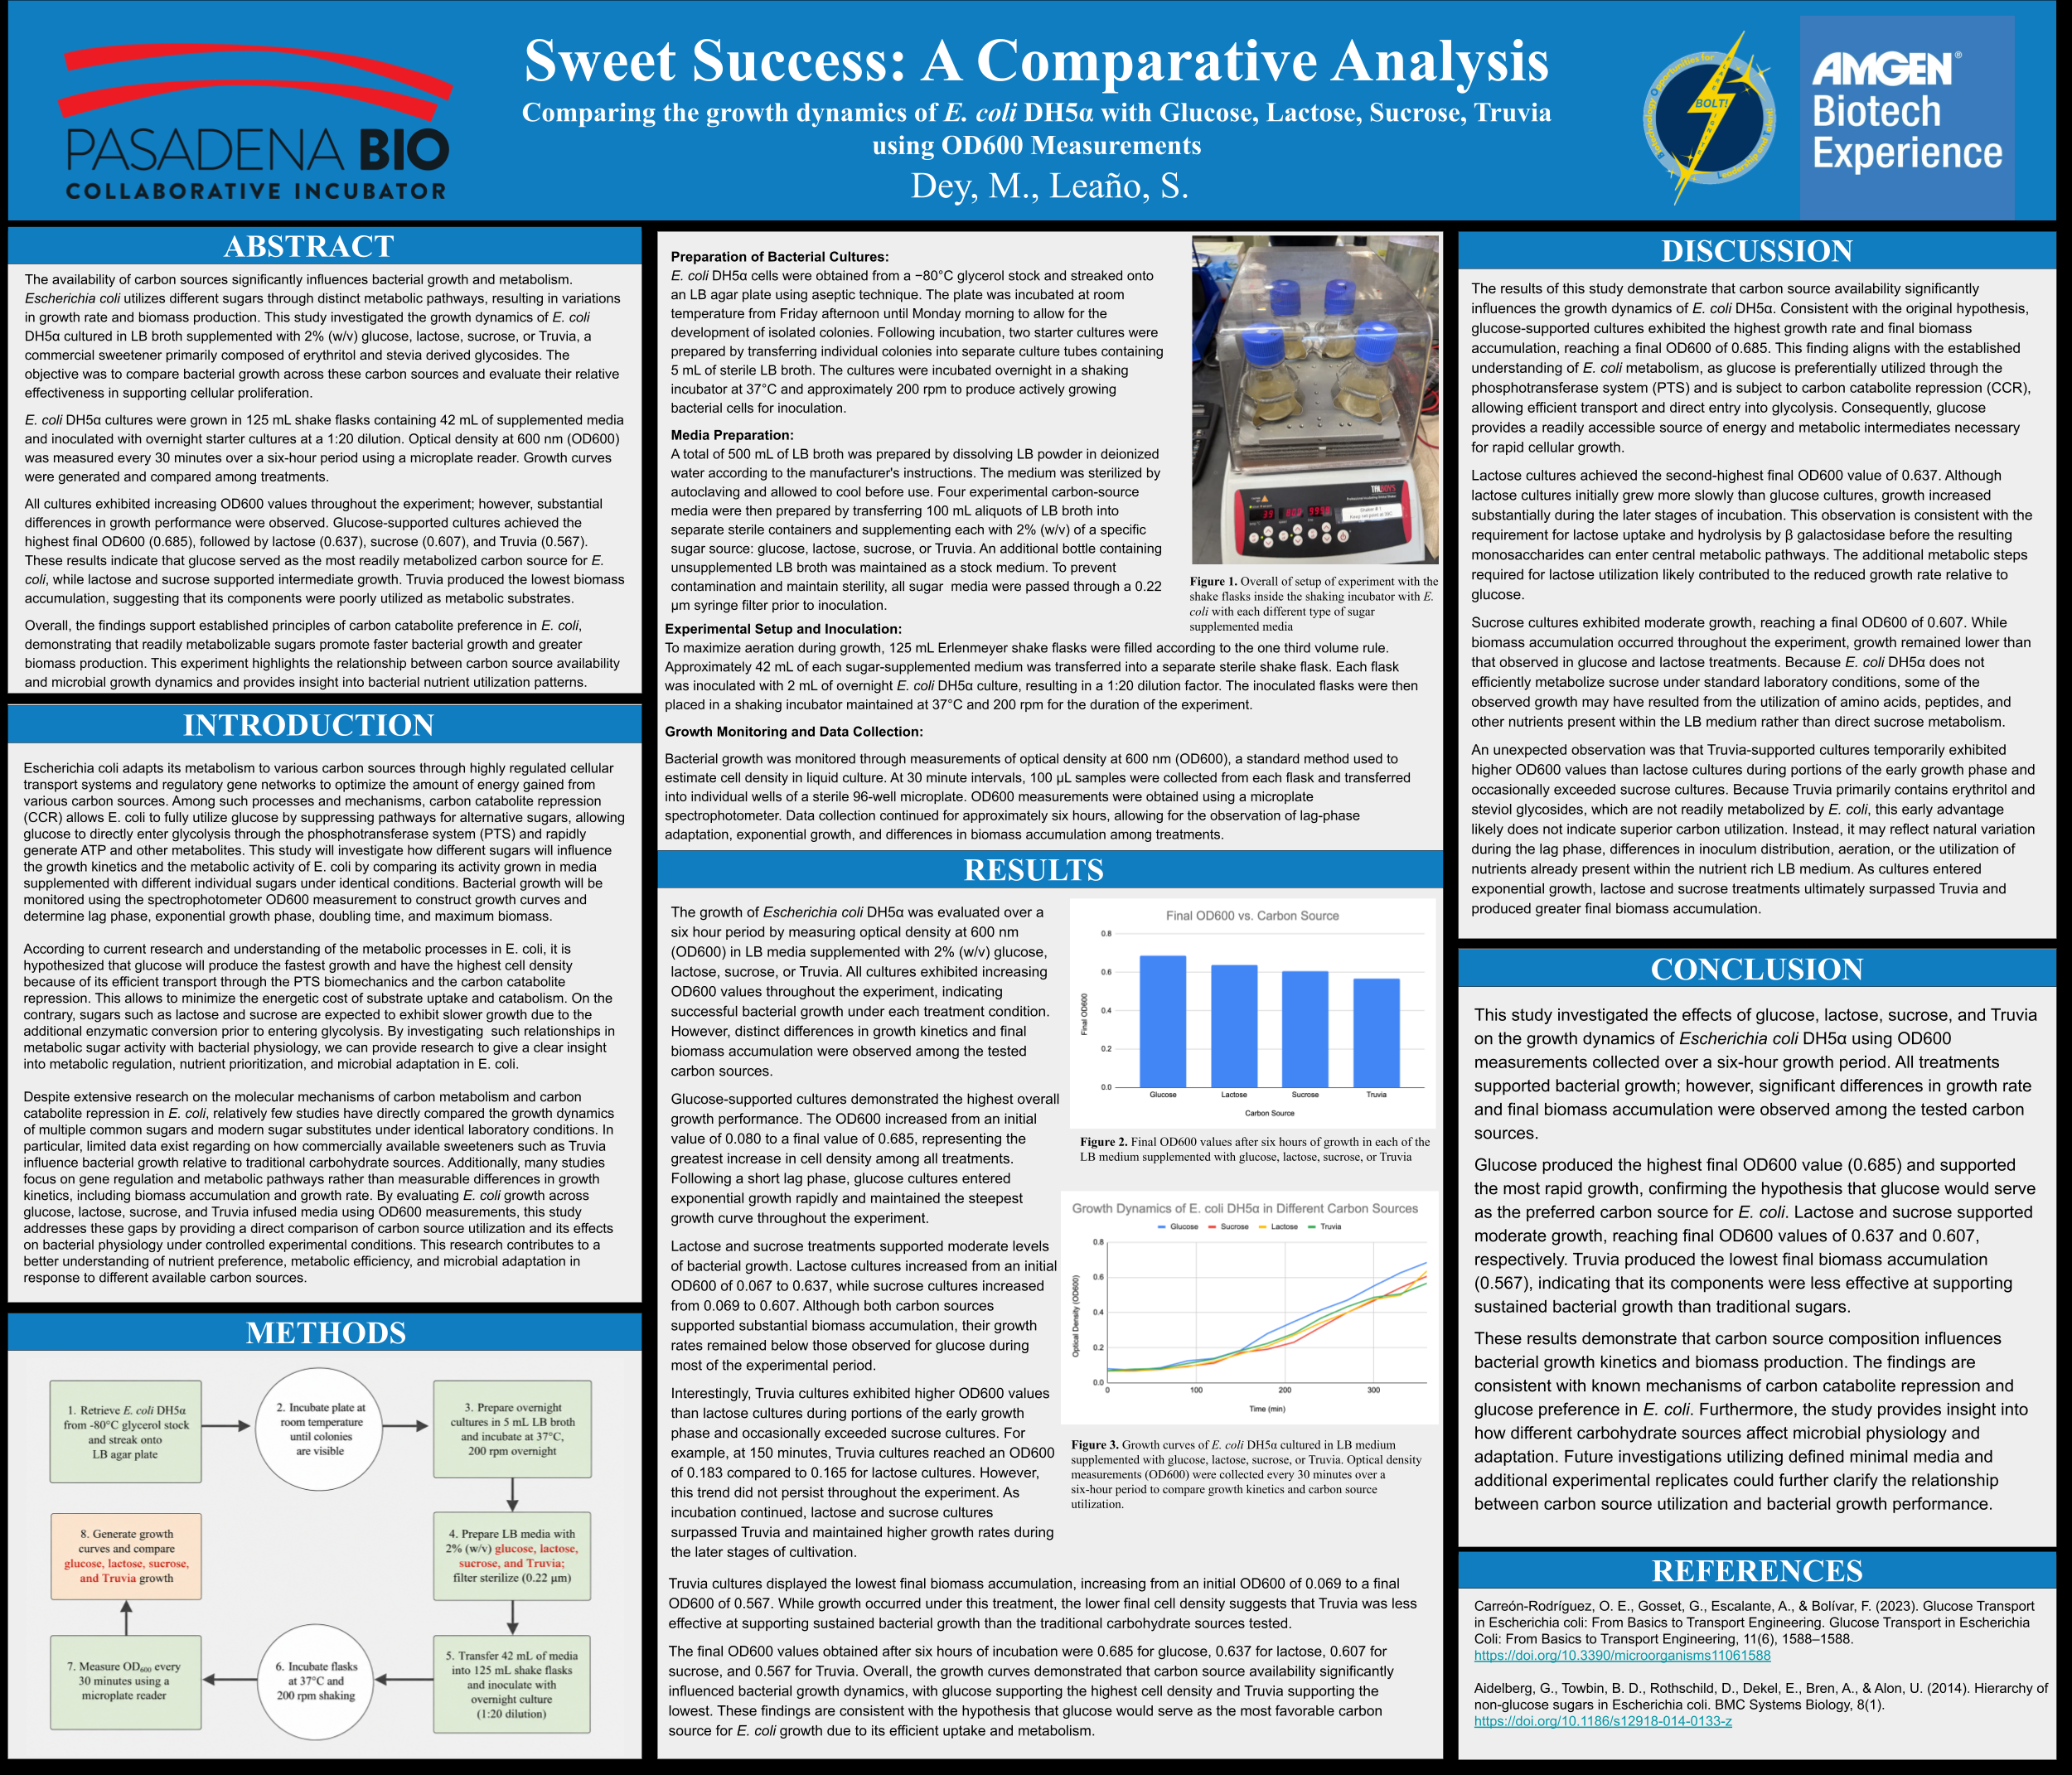
Preparation of Bacterial Cultures:
E. coli DH5α cells were obtained from a −80°C glycerol stock and streaked onto an LB agar plate using aseptic technique. The plate was incubated at room temperature from Friday afternoon until Monday morning to allow for the development of isolated colonies. Following incubation, two starter cultures were prepared by transferring individual colonies into separate culture tubes containing 5 mL of sterile LB broth. The cultures were incubated overnight in a shaking incubator at 37°C and approximately 200 rpm to produce actively growing bacterial cells for inoculation.
Media Preparation:
A total of 500 mL of LB broth was prepared by dissolving LB powder in deionized water according to the manufacturer's instructions. The medium was sterilized by autoclaving and allowed to cool before use. Four experimental carbon-source media were then prepared by transferring 100 mL aliquots of LB broth into separate sterile containers and supplementing each with 2% (w/v) of a specific sugar source: glucose, lactose, sucrose, or Truvia. An additional bottle containing unsupplemented LB broth was maintained as a stock medium. To prevent contamination and maintain sterility, all sugar media were passed through a 0.22 μm syringe filter prior to inoculation.
Experimental Setup and Inoculation:
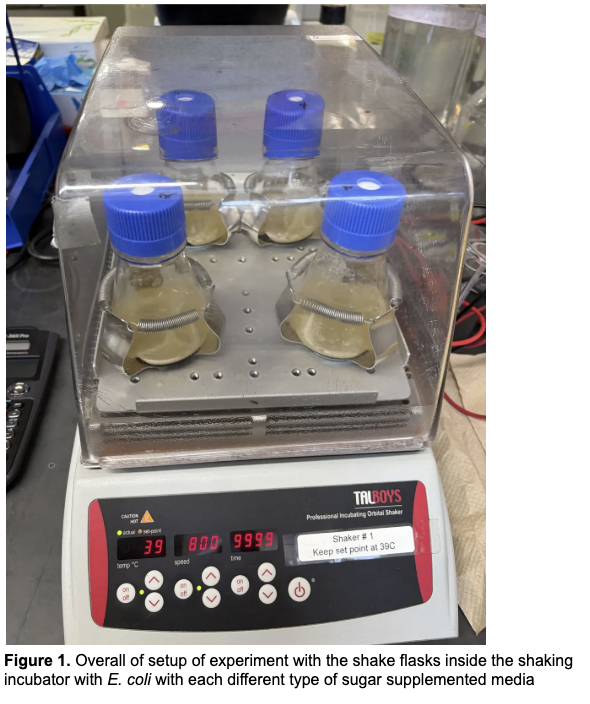
To maximize aeration during growth, 125 mL Erlenmeyer shake flasks were filled according to the one third volume rule. Approximately 42 mL of each sugar-supplemented medium was transferred into a separate sterile shake flask. Each flask was inoculated with 2 mL of overnight E. coli DH5α culture, resulting in a 1:20 dilution factor. The inoculated flasks were then placed in a shaking incubator maintained at 37°C and 200 rpm for the duration of the experiment.
Growth Monitoring and Data Collection:
Bacterial growth was monitored through measurements of optical density at 600 nm (OD600), a standard method used to estimate cell density in liquid culture. At 30 minute intervals, 100 μL samples were collected from each flask and transferred into individual wells of a sterile 96-well microplate. OD600 measurements were obtained using a microplate spectrophotometer. Data collection continued for approximately six hours, allowing for the observation of lag-phase adaptation, exponential growth, and differences in biomass accumulation among treatments.
Results: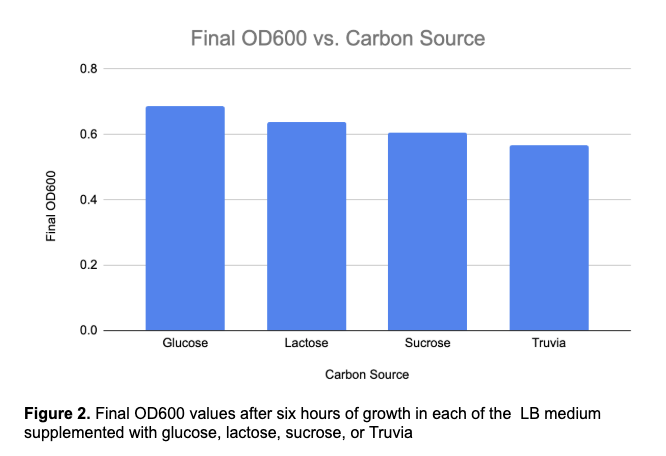
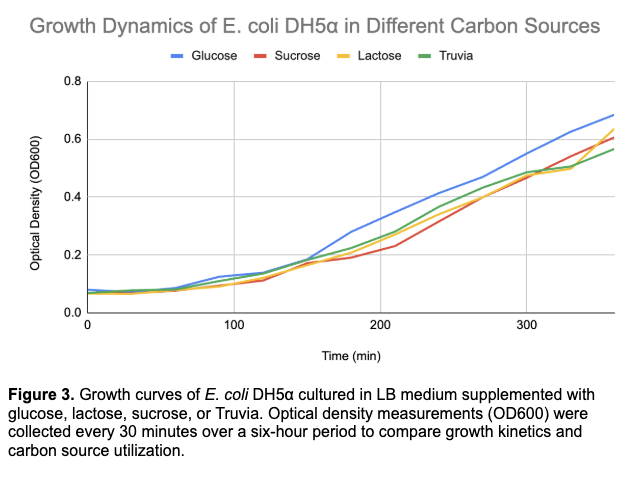
The growth of Escherichia coli DH5α was evaluated over a six hour period by measuring optical density at 600 nm (OD600) in LB media supplemented with 2% (w/v) glucose, lactose, sucrose, or Truvia. All cultures exhibited increasing OD600 values throughout the experiment, indicating successful bacterial growth under each treatment condition. However, distinct differences in growth kinetics and final biomass accumulation were observed among the tested carbon sources.
Glucose-supported cultures demonstrated the highest overall growth performance. The OD600 increased from an initial value of 0.080 to a final value of 0.685, representing the greatest increase in cell density among all treatments. Following a short lag phase, glucose cultures entered exponential growth rapidly and maintained the steepest growth curve throughout the experiment.
Lactose and sucrose treatments supported moderate levels of bacterial growth. Lactose cultures increased from an initial OD600 of 0.067 to 0.637, while sucrose cultures increased from 0.069 to 0.607. Although both carbon sources supported substantial biomass accumulation, their growth rates remained below those observed for glucose during most of the experimental period.
Interestingly, Truvia cultures exhibited higher OD600 values than lactose cultures during portions of the early growth phase and occasionally exceeded sucrose cultures. For example, at 150 minutes, Truvia cultures reached an OD600 of 0.183 compared to 0.165 for lactose cultures. However, this trend did not persist throughout the experiment. As incubation continued, lactose and sucrose cultures surpassed Truvia and maintained higher growth rates during the later stages of cultivation.
Truvia cultures displayed the lowest final biomass accumulation, increasing from an initial OD600 of 0.069 to a final OD600 of 0.567. While growth occurred under this treatment, the lower final cell density suggests that Truvia was less effective at supporting sustained bacterial growth than the traditional carbohydrate sources tested.
The final OD600 values obtained after six hours of incubation were 0.685 for glucose, 0.637 for lactose, 0.607 for sucrose, and 0.567 for Truvia. Overall, the growth curves demonstrated that carbon source availability significantly influenced bacterial growth dynamics, with glucose supporting the highest cell density and Truvia supporting the lowest. These findings are consistent with the hypothesis that glucose would serve as the most favorable carbon source for E. coli growth due to its efficient uptake and metabolism.
Discussion:
The results of this study demonstrate that carbon source availability significantly influences the growth dynamics of E. coli DH5α. Consistent with the original hypothesis, glucose-supported cultures exhibited the highest growth rate and final biomass accumulation, reaching a final OD600 of 0.685. This finding aligns with the established understanding of E. coli metabolism, as glucose is preferentially utilized through the phosphotransferase system (PTS) and is subject to carbon catabolite repression (CCR), allowing efficient transport and direct entry into glycolysis. Consequently, glucose provides a readily accessible source of energy and metabolic intermediates necessary for rapid cellular growth.
Lactose cultures achieved the second-highest final OD600 value of 0.637. Although lactose cultures initially grew more slowly than glucose cultures, growth increased substantially during the later stages of incubation. This observation is consistent with the requirement for lactose uptake and hydrolysis by β galactosidase before the resulting monosaccharides can enter central metabolic pathways. The additional metabolic steps required for lactose utilization likely contributed to the reduced growth rate relative to glucose.
Sucrose cultures exhibited moderate growth, reaching a final OD600 of 0.607. While biomass accumulation occurred throughout the experiment, growth remained lower than that observed in glucose and lactose treatments. Because E. coli DH5α does not efficiently metabolize sucrose under standard laboratory conditions, some of the observed growth may have resulted from the utilization of amino acids, peptides, and other nutrients present within the LB medium rather than direct sucrose metabolism.
An unexpected observation was that Truvia-supported cultures temporarily exhibited higher OD600 values than lactose cultures during portions of the early growth phase and occasionally exceeded sucrose cultures. Because Truvia primarily contains erythritol and steviol glycosides, which are not readily metabolized by E. coli, this early advantage likely does not indicate superior carbon utilization. Instead, it may reflect natural variation during the lag phase, differences in inoculum distribution, aeration, or the utilization of nutrients already present within the nutrient rich LB medium. As cultures entered exponential growth, lactose and sucrose treatments ultimately surpassed Truvia and produced greater final biomass accumulation.
Conclusion:
This study investigated the effects of glucose, lactose, sucrose, and Truvia on the growth dynamics of Escherichia coli DH5α using OD600 measurements collected over a six-hour growth period. All treatments supported bacterial growth; however, significant differences in growth rate and final biomass accumulation were observed among the tested carbon sources.
Glucose produced the highest final OD600 value (0.685) and supported the most rapid growth, confirming the hypothesis that glucose would serve as the preferred carbon source for E. coli. Lactose and sucrose supported moderate growth, reaching final OD600 values of 0.637 and 0.607, respectively. Truvia produced the lowest final biomass accumulation (0.567), indicating that its components were less effective at supporting sustained bacterial growth than traditional sugars.
These results demonstrate that carbon source composition influences bacterial growth kinetics and biomass production. The findings are consistent with known mechanisms of carbon catabolite repression and glucose preference in E. coli. Furthermore, the study provides insight into how different carbohydrate sources affect microbial physiology and adaptation. Future investigations utilizing defined minimal media and additional experimental replicates could further clarify the relationship between carbon source utilization and bacterial growth performance.
References:
Carreón-Rodríguez, O. E., Gosset, G., Escalante, A., & Bolívar, F. (2023). Glucose Transport in Escherichia coli: From Basics to Transport Engineering. Glucose Transport in Escherichia Coli: From Basics to Transport Engineering, 11(6), 1588–1588. https://doi.org/10.3390/microorganisms11061588
Aidelberg, G., Towbin, B. D., Rothschild, D., Dekel, E., Bren, A., & Alon, U. (2014). Hierarchy of non-glucose sugars in Escherichia coli. BMC Systems Biology, 8(1). https://doi.org/10.1186/s12918-014-0133-z